First-Time Fix Rate: How to Measure and Improve It
Quick answer: First-time fix rate (FTFR) is the percentage of service jobs an engineer resolves on the first visit, with no return trip, no missing part and no follow-up. You calculate it by dividing jobs fixed first time by total jobs attempted, then multiplying by 100. The industry average sits around 76–80%, the best operations clear 87%, and anything below 70% is a warning sign — because every failed first visit means a customer left waiting and a second truck on the road.
Key takeaways
- First-time fix rate is the single clearest measure of whether your field operation is prepared — it folds scheduling, parts, skills and information into one number.
- The formula is simple: (jobs fixed on the first visit ÷ total jobs attempted) × 100.
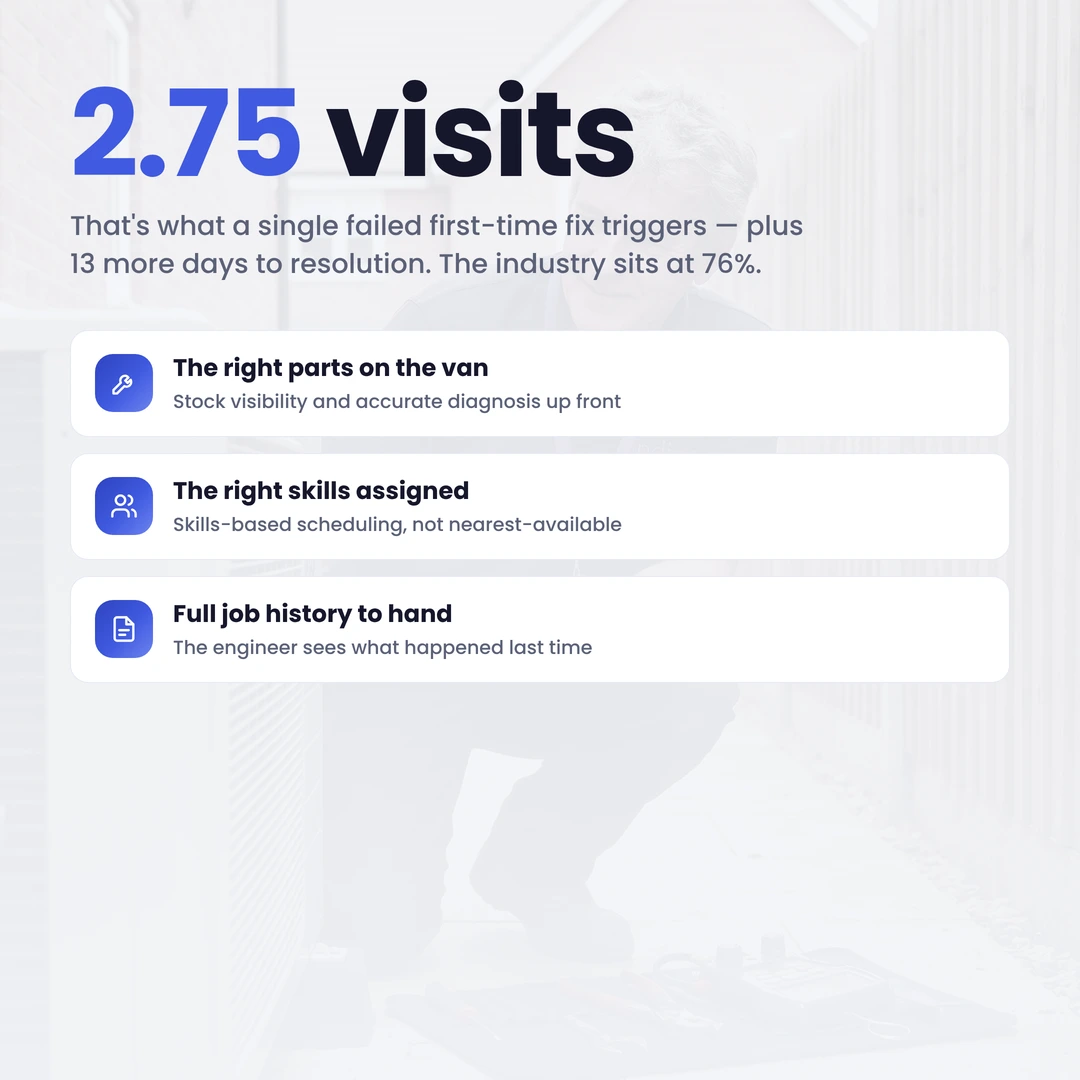
- A failed first visit is expensive: it triggers an average of 2.7 more visits and adds 13 days to resolution (Aquant, 2023)
- The benchmark to beat is roughly 76–80% average, 87%+ for top performers (Aquant; CompareSoft)
- The five levers that move FTFR are scheduling/skills match, parts availability, knowledge access, mobile tooling, and — the one most operations under-use — getting the right information to the engineer before they arrive.
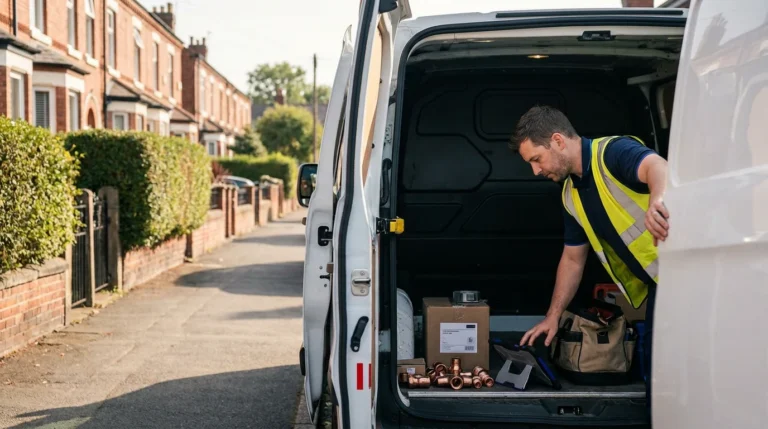
A technician pulls up to a job, walks in, and within five minutes knows they can’t finish it. The part isn’t on the van. The fault is different from the one on the work order. The customer mentions a detail nobody passed on. The visit is logged, a second appointment booked, and a problem that should have taken one trip now takes two — or three.
That moment is what first-time fix rate measures, and it’s why the metric matters more than almost any other in field service management. A high first-time fix rate means your operation is arriving prepared. A low one means you’re paying twice to fix things once, and your customers are absorbing the delay. This guide covers what FTFR is, how to calculate it, what good looks like, and the five levers that actually move it.
What is first-time fix rate?
First-time fix rate is the share of service jobs completed on the first visit, without a return trip, additional parts or external support. It’s usually written as FTFR and expressed as a percentage.
The metric only counts a job as a “first-time fix” when the engineer fully resolves the issue in one appointment — the customer’s problem is gone, not deferred. A visit that ends with “we’ll need to come back with the right part” is a failed first fix, even if everyone was polite and the diagnosis was correct. That strictness is the point. FTFR rewards being ready, not just turning up.
It’s also the metric that quietly contains all the others. A job fails on the first visit for a small number of reasons: the wrong engineer was sent, the parts weren’t there, the information was incomplete, or the work was scoped wrong. So when first-time fix rate moves, it’s telling you something about scheduling, inventory, skills and data all at once. That’s why service leaders treat it as a headline KPI rather than a niche operational stat.
How to calculate first-time fix rate (the formula)
The first-time fix rate formula is straightforward: divide the number of jobs fixed on the first visit by the total number of jobs attempted in a period, then multiply by 100.
FTFR (%) = (Jobs fixed on the first visit ÷ Total jobs attempted) × 100
So if your engineers attempted 1,000 jobs last month and resolved 820 of them in a single visit, your first-time fix rate is 82%. (CompareSoft and IBM both define the calculation this way.)
Two details decide whether the number is honest. The first is your measurement window. Aquant’s analysis of 16.2 million work orders found that organisations measuring FTFR over 7- or 14-day windows flatter themselves: a fault that recurs three weeks later gets logged as two separate “first-time fixes”, while the customer experienced one unresolved problem. Measuring over a 30-day window strips out those false positives. The second is what you count as a fix — resolution from the customer’s point of view, not a closed ticket. Get those two definitions right before you benchmark anything, or you’ll be improving a number that doesn’t reflect reality.

Why first-time fix rate matters: the cost of the repeat visit
Every failed first visit is expensive twice over: once on the cost line, once on the customer relationship.

Start with the operational cost. Aquant’s 2023 Field Service Benchmark Report found that a failed first visit leads to an average of 2.7 additional visits and adds 13 days to mean time to resolution. The Aberdeen Group has long pegged the cost of each additional dispatch at $200–$300 in labour, fuel and lost capacity. Multiply that across an enterprise operation running thousands of jobs a month and a few points of FTFR is a material line in the budget. There’s an opportunity cost too: every van sent back to a job it should have finished is a van not available for a new one.
Then there’s the customer. A repeat visit is one of the fastest ways to erode trust — the customer took time off, waited in, and still has a broken appliance or a cold house. IBM, citing Aberdeen, notes that an FTFR below 70% measurably damages customer retention, satisfaction and SLA compliance. This is where the operational metric becomes a field service customer experience metric: the repeat visit is felt by the customer long before it shows up in a churn report. Fix more jobs first time and you improve both numbers at once, which is rare and worth chasing.
What is a good first-time fix rate? Benchmarks
Most credible benchmarks land in the same band: a healthy first-time fix rate is around 76–80%, strong is 87%+, and below 70% signals a problem.
The most rigorous public figure comes from Aquant’s 2024 Field Service Benchmark Report, drawn from millions of work orders: the average FTFR is 76%, the top quintile reaches 87%, and the bottom quintile sits at 55% (measured over 30 days). CompareSoft frames it slightly more generously for a broad audience — an industry average near 80%, with 90%+ marking a high achiever and under 70% putting the business at risk. The long-cited Aberdeen number is roughly 75%, which it summarises memorably: one in four service calls still needs a return visit.
The exact figure varies by sector (a narrow, well-documented service environment will run higher than a complex multi-asset estate) so the more useful exercise is to baseline your own rate over a 30-day window and track the trend. You can only manage what you measure, and field service analytics that surface FTFR by region, engineer, job type and root cause turn a single headline number into something you can act on. The benchmark tells you roughly where you stand; your own trend line tells you if it’s improving.
How to improve first-time fix rate: 5 levers
Improving first-time fix rate — getting closer to “right first time” — comes down to five levers. Aberdeen’s research is blunt about where the problems originate: parts (51%), engineer skills (25%) and insufficient time on site (13%) account for the bulk of failed visits. The levers map directly onto those causes.
1. Schedule the right engineer to the right job (skills match). A failed visit often starts at dispatch, when a job goes to whoever’s nearest rather than whoever’s qualified. Match the engineer’s certifications and experience to the fault before assigning, and you remove a quarter of failure causes at the source. Good scheduling weighs skills, not just travel time.
2. Get the right parts on the van. Parts are the single biggest cause of repeat visits. The fix is tighter diagnosis before dispatch (so you know what the job needs) and connecting inventory to the work order (so the engineer leaves the depot with it). Van-stock optimisation based on job history closes much of the gap.
3. Put knowledge in the engineer’s hands. Service history, manuals, schematics and the notes from previous visits should be on the device in the engineer’s hand, not in a filing cabinet. When technicians can see how a similar fault was resolved last time, they fix more in one trip, which is exactly why knowledge-led tools have become a focus across the industry.
4. Give engineers proper mobile tooling. Real-time access to the work order, the customer record and the ability to update the job from site keeps the engineer self-sufficient. A technician who has to phone the office to check a detail is a technician one missing answer away from a return trip.
5. Get the right information to the engineer before they arrive. This is the lever most operations under-use, and it’s the one that moves the number most. A surprising share of failed visits come down to a mismatch between what was booked and what’s actually on site: the wrong access details, an unmentioned second fault, a photo of the unit that would have changed which part the engineer packed. When the customer can add notes and photos to the engineer before the visit, the engineer arrives knowing what they’re walking into. E.ON improved appointment-based first-time job completion by 19% largely by closing this information gap, getting the right detail to the engineer ahead of arrival.
None of these levers requires replacing your scheduling system. They’re about feeding it better inputs, which is where the customer comes in.
How customer communication and self-service raise first-time fix rate
The most overlooked source of first-time-fix improvement isn’t inside the operation at all. It’s the customer, who often holds the one piece of information that determines whether the visit succeeds.
The person who booked the appointment knows things the work order doesn’t: that the boiler is in a locked outbuilding, that the fault changed since they called, that there’s a second unit playing up. Capture that before the engineer leaves the depot and you change what they pack and how they prepare. This is the mechanism behind that 19% improvement above, and it’s why a customer-facing layer matters to an operational metric. When customers can confirm details, add notes and photos to the engineer and flag access requirements ahead of the visit, the information gap that causes a chunk of failed fixes closes before anyone gets in a van.
The results show up in the numbers. Brinks Home, which gave customers proactive communication and self-service, improved appointment-based first-time job completion by 25%, while cutting ETA-related calls by 34% — the same intervention lifting the operational metric and deflecting contact-centre volume at once. Self-service rescheduling helps too: a customer who can move an appointment they’re no longer ready for prevents a wasted visit entirely, which is the cleanest first-time fix there is — the one you didn’t have to make twice. (We cover the experience side of this in our guide to customer-satisfaction metrics.)
Getting started: a practical sequence
You don’t fix first-time fix rate in one project. A sensible order of operations:
- Baseline honestly. Measure FTFR over a 30-day window, by region, job type and engineer. Expect the headline number to be lower than your weekly reports suggest.
- Find your dominant failure cause. Tag a month of failed visits as parts, skills, information or time. Most operations are concentrated in one or two buckets — fix those first.
- Close the information gap. Of the five levers, pre-visit customer information is usually the fastest to deploy and the cheapest, because it uses the customer you already have. It also improves the experience as a by-product.
- Track the trend, not the snapshot. A single month means little; the slope over a quarter tells you whether your changes are working.
The encouraging part is that the same moves that lift first-time fix rate (better scheduling, better information, a customer who can tell you what you need to know) also cut calls, reduce no-shows and raise satisfaction. Fix the operation and you fix the experience with it; one set of changes covers both.
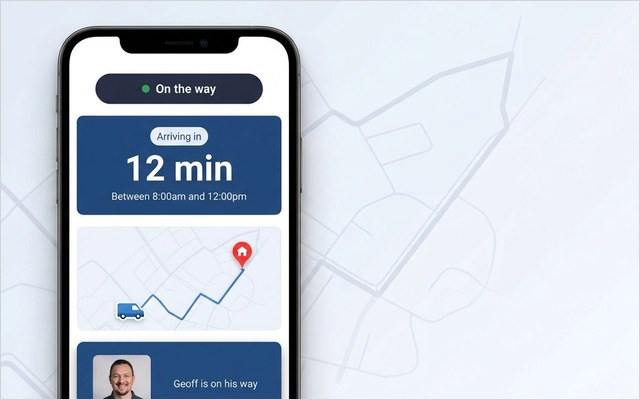
See how it works on your operation. On My Way sits on top of your existing WFM and gets the right information to your engineers before they arrive — customer notes, photos and access details ahead of every visit — alongside tracking, self-service rescheduling and real-time feedback. Book a 30-minute working session (no slide deck) or see how On My Way works.
Frequently asked questions
What is first-time fix rate (FTFR)? First-time fix rate is the percentage of service jobs an engineer resolves on the first visit, without a return trip, extra parts or outside help. It’s a core field service KPI because it reflects how well-prepared an operation is — a job only fails on the first visit if scheduling, parts, skills or information let it down.
How do you calculate first-time fix rate? Divide the number of jobs fixed on the first visit by the total number of jobs attempted in a period, then multiply by 100. For example, 820 first-visit fixes out of 1,000 jobs is an 82% FTFR. Measure over a 30-day window so that faults recurring weeks later aren’t wrongly counted as successful first fixes.
What is a good first-time fix rate? Around 76–80% is a healthy average, 87% or higher marks a top performer, and below 70% signals a problem (Aquant; CompareSoft; Aberdeen). The right target varies by sector, so baseline your own rate over a 30-day window and focus on the trend rather than a single benchmark figure.
Why does first-time fix rate matter? Because failed first visits are expensive and damage trust. A failed visit triggers an average of 2.7 more visits and adds 13 days to resolution (Aquant, 2023), and each extra dispatch costs roughly $200–$300 (Aberdeen). An FTFR below 70% also measurably hurts customer retention, so improving it cuts cost and lifts satisfaction together.
How can I improve my first-time fix rate? Match the right engineer to each job, get the right parts on the van, put service history and knowledge on the engineer’s device, give them proper mobile tooling, and, the move with the most impact, capture the right information from the customer before the visit. The first four address the operation; the fifth closes the gap that causes many “we’ll have to come back” visits.
What’s the difference between first-time fix rate and right first time? They describe the same idea from different angles. “Right first time” is the broader quality principle — do the job correctly on the first attempt — while first-time fix rate is the specific metric that quantifies it as a percentage of jobs resolved in one visit. In field service the two are used almost interchangeably.
References
- Aquant — 2024 Field Service Benchmark Report (average FTFR 76%; top quintile 87%; bottom 55%, 30-day window)
- Aquant — What First Time Fix Rate Can’t Tell You About Service Performance (failed first visit → 2.7 additional visits, +13 days; 2023 benchmark, 16.2M work orders)
- CompareSoft — What Is First-Time Fix Rate & How to Improve Your FTFR (formula; ~80% average, 90%+ high achiever, <70% at risk)
- IBM — What is First-Time Fix Rate (FTFR)? (definition; Aberdeen <70% retention finding)
- Aberdeen Group — Fixing First-Time Fix: Repairing Field Service Efficiency (causes of failed visits: parts 51%, skills 25%, time 13%; ~$200–$300 per extra dispatch)
- ServiceTitan — Key Field Service Metrics for Tracking Performance (FTFR as a core operational KPI; benchmark context)
- On My Way / Leadent Digital — enterprise deployment data (first-time-completion and first-time-fix outcomes).

Keep your WFM. Upgrade what your customers experience.
On My Way is the customer-experience layer for field service: live arrival tracking, self-service rebooking, notes and photos, and feedback — added on top of the scheduling system you already run. No rip-and-replace, live in 4–6 weeks.